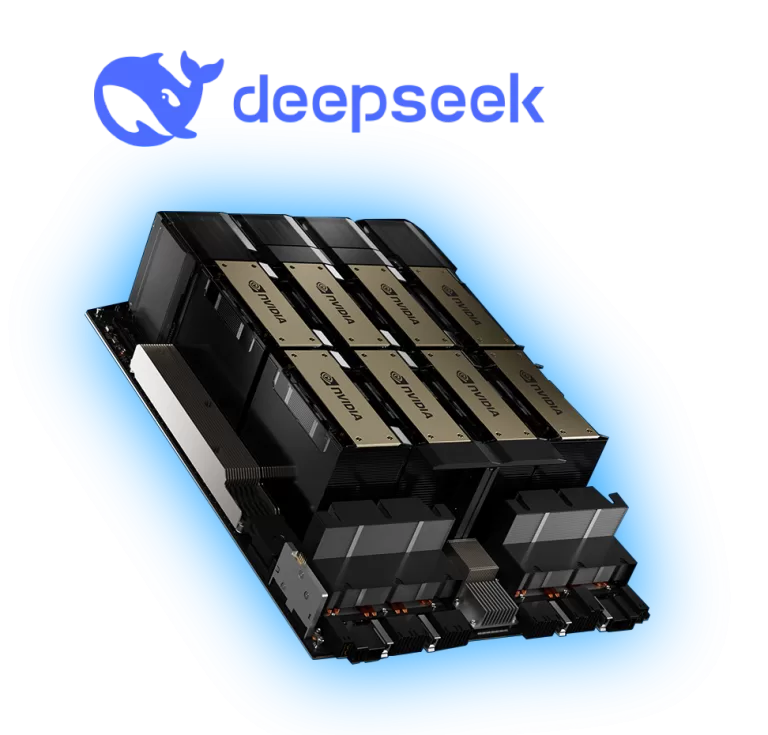
NVIDIA H200 DeepSeek-V3 Benchmark Report
Table of Contents
Overview
This NVIDIA H200 DeepSeek-V3 benchmark report evaluates the performance of the model running on an SGLang server using 8x NVIDIA H200 GPUs and 2x AMD EPYC 9654 CPUs (192 cores total). The goal was to analyze latency, throughput, and scalability under different request loads.
System Configuration
Hardware:
- 8x NVIDIA H200 GPUs (80GB VRAM each)
- 2x AMD EPYC 9654 CPUs (192 cores, 384 threads)
- 1.65 TB RAM
Software:
- OS: Ubuntu 20.04.6 LTS (Focal Fossa)
- Kernel: 5.15.0-131-generic #141-Ubuntu SMP
- Nvidia Driver Version: 565.57.01 CUDA Version: 12.7
- SGLang Version: v0.4.2
Test Setup
SGLang server was launched with:
python3 -m sglang.launch_server –model deepseek-ai/DeepSeek-V3 –tp 8 –trust-remote-code –enable-torch-compile –mem-fraction-static 0.8 –disable-cuda-graph –enable-dp-attentio
Parameters:
- enable-torch-compile: it attempts to compile the model to improve speed and efficiency by reducing Python overhead and fusing operations
- mem-fraction-static: controls how much of the GPU memory is statically allocated avoiding fragmentation
- disable-cuda-graph: disables the use of CUDA Graphs for compatibility purposes
- enable-dp-attention: can improve throughput for large QPS scenarios for Deepseek models
Benchmark was launched with:
python3 -m sglang.bench_serving –backend sglang –dataset-name random –random-range-ratio 1 –num-prompt 300 –request-rate 1 –random-input 1024 –random-output 1024
python3 -m sglang.bench_serving –backend sglang –dataset-name random –random-range-ratio 1 –num-prompt 600 –request-rate 2 –random-input 1024 –random-output 1024
python3 -m sglang.bench_serving –backend sglang –dataset-name random –random-range-ratio 1 –num-prompt 1200 –request-rate 4 –random-input 1024 –random-output 1024
python3 -m sglang.bench_serving –backend sglang –dataset-name random –random-range-ratio 1 –num-prompt 2400 –request-rate 8 –random-input 1024 –random-output 1024
Benchmark Results
Each benchmark test used random input and output lengths of 1024 tokens, simulating real-world workloads with varying request rates. The tests measured key performance metrics related to token generation speed and efficiency:
- TTFT (Time To First Token): The time elapsed from the moment an inference request is sent until the model produces its first output token. A lower TTFT indicates faster response times, critical for interactive applications.
- ITL (Inter-Token Latency): The time taken between the generation of consecutive tokens in an auto-regressive decoding sequence. ITL measures the step-by-step processing speed, tracking the interval from the completion of token i to the completion of token i+1.
- TPOT (Time Per Output Token): The average time required to generate each subsequent token after the first token is produced. This metric reflects the overall efficiency of the model’s token-generation process.
- Output Token Throughput: The number of tokens generated per second, indicating how efficiently the model processes requests. Higher throughput means the model can handle larger batch sizes and higher concurrency.
| Request Rate (per second) | Requests Completed | Median TTFT (ms) | Median ITL (ms) | Median TPOT (ms) | Output Token Throughput (per second) |
|---|---|---|---|---|---|
| 1 | 300 | 942 | 185 | 229 | 608 |
| 2 | 600 | 928 | 189 | 246 | 1,244 |
| 4 | 1,200 | 1,148 | 224 | 302 | 2,398 |
| 8 | 2,400 | 1,944 | 248 | 511 | 2,288 |
Analysis and Insights
Latency Analysis:
The Time To First Token (TTFT) decreases slightly between a request rate of 1 and 2 but increases at higher loads (4 and 8 RPS). This suggests that while the system scales well, latency starts to increase due to resource contention at higher loads.
Inter-Token Latency (ITL) follows a similar trend, increasing as the request rate grows, indicating that the per-token processing time is affected by concurrency overhead.
Throughput Trends:
Output token throughput increases significantly with higher request rates, peaking at 2398 tokens/sec at 4 RPS before slightly dropping at 8 RPS (2288 tokens/sec). This suggests the system reaches peak efficiency around 4 RPS before memory bandwidth or compute limitations impact performance.
The drop at 8 RPS could be a result of increased scheduling overhead or memory contention across multiple GPUs.
Scalability Observations:
While the system scales well from 1 to 4 RPS, performance gains diminish beyond 4 RPS, highlighting a potential optimization opportunity for parallelism or memory management.
Conclusion
The NVIDIA H200 GPUs demonstrate strong performance in running DeepSeek-V3 inference workloads with excellent token throughput and competitive latency metrics. The setup efficiently scales up to 4 RPS, beyond which diminishing returns are observed due to system constraints.
Further optimizations could enhance throughput at higher concurrency levels, particularly in reducing TTFT and ITL at peak loads.
This benchmark underscores the NVIDIA H200’s capabilities for large-scale AI workloads, inference tasks, and high-throughput applications in production environments.
Looking forward, refining kernel tuning and optimizing inference engines such as SGLang will likely unlock even greater scalability and throughput. These advancements have the potential to redefine efficiency in high-performance LLM deployment.
